Most of us have been in situations where we have to debug performance problems in Java based applications based on little more information than thread dumps and the garbage collection logs. With the many tunable parameters that the newer JVMs offer, its easy to get the garbage collection configuration wrong for your environment. Fortunately, the latest JVMs offer ergonomics, where less is more - you specify a few parameters for tuning, and let the JVM figure out the rest.
If you invoke the JVM with the -Xloggc:logfile parameter, the Garbage Collector (GC) will faithfully write out what its doing to the named logfile. Each line in the log file corresponds to a GC operation. There are two kinds of lines, one for partial GC and one for full GC.
1
2
3
4
5
6
7
8
9
10
11 | 112829.094: [GC 695486K->557348K(806720K), 0.0191830 secs]
...
112776.534: [Full GC 690522K->551411K(817408K), 1.8249860 secs]
...
^ ^ ^ ^ ^ ^
| | | | | +- time taken for this GC operation
| | | | +----------- total JVM heap size (Kb)
| | | +------------------- heap used after GC (Kb)
| | +-------------------------- heap used before GC (Kb)
| +----------------------------------- Full/Partial GC
+---------------------------------------------- Timestamp (sec) since JVM startup
|
While there is lot of information about the GC operation in the line, it is hard to see interrelations between successive GC operations and its correlation with thread spikes on the application server. I think the main problem is the timestamp. If it had been a regular ISO-8601 style timestamp, then it would be much more useful for troubleshooting.
Anyway, so there I was, trying to correlate thread dumps to an increase in frequency in garbage collection, trying to answer whether the garbage collection tuning parameters we had chosen were "correct" for the application, and it occured to me that it would be fairly easy and immensely helpful to be able to see these numbers in a chart.
The script that does the charting is written in Python, and uses an open source 2D plotting library called matplotlib, also written in Python.
I already had Python installed. Installing matplotlib was a little involved, and I describe it briefly here. The matplotlib package is dependent on freetype, libpng and zlib (both devel and binary are needed), as well as python libraries for numeric computation, such as numpy. So the sequence of steps would go something like this:
- Install freetype, libpng, zlib - I already had the binary RPMs in my Fedora Core 3 system, as well as zlib-devel. So the only things I needed was freetype-devel and libpng-devel.
- Download and install numpy.
- Download and install matplotlib.
- Set up matplotlibrc - I did not have TkInter installed, so I could not use any of the windowing toolkits for graphics. So I set the backend in .matplotlib/matplotlibrc file to Agg.
The complete sequence of commands I needed was as follows:
1
2
3
4
5
6
7
8
9 | $ yum install freetype-devel
$ yum install libpng-devel
$ cd downloads/numpy-1.0b1
$ python setup.py install
$ cd downloads/matplotlib-0.87.4
$ python setup.py build
$ python setup.py install # requires ROOT permission
|
Once matplotlib was installed, the code was fairly simple. Basically, the GC log is read line by line, matched to one of the regular expressions for partial or full GC, and tokenized. These tokens are then appended to a series of arrays. Once all the lines have been read, some postprocessing is done on some of the arrays to normalize the timestamps relative to the creation time of the log file (so we get real timestamps instead of seconds since JVM startup).
 1
 2
 3
 4
 5
 6
 7
 8
 9
10
11
12
13
14
15
16
17
18
19
20
21
22
23
24
25
26
27
28
29
30
31
32
33
34
35
36
37
38
39
40
41
42
43
44
45
46
47
48
49
50
51
52
53
54
55
56
57
58
59
60
61
62
63
64
65
66
67
68
69
70
71
72
73
74
75
76
77
78
79
80
81
82
83
84
85
86
87
88
89
90
91
92
93
94
95
96
97
98
99
100
101
102
103
104
105
106
107
108
109
110
111
112
113
114
115
116
117
118
119
120
121
122
123
124
125
126
127
128
129
130
131
132
133
134
135
136
137
138
139
140
141
142
143
144
145
146
147
148
149
150
151
152
153
154
155
156
157
158
159
160
161
162
163
164
165
166
167
168
169
170
171
172
173
174
175
176
177
178
179
180
181
182 | #!/usr/bin/python
import os
import sys
import re
import time
from stat import *
from pylab import *
def parse(line):
"""
Parses an input line from gc.log into a set of tokens and returns them.
There are two patterns we have to look for:
112829.094: [GC 695486K->557348K(806720K), 0.0191830 secs]
112776.534: [Full GC 690522K->551411K(817408K), 1.8249860 secs]
"""
pgre = re.compile("(\d+\.\d+):\s\[.+\]\s+(\d+)K->(\d+)K\((\d+)K\),\s(\d+\.\d+)\ssecs\]")
fre = re.compile("(\d+\.\d+):\s\[.+\]\s+(\d+)K->(\d+)K\((\d+)K\)\s\[.+\],\s(\d+\.\d+)\ssecs\]")
# First try matching with the partial GC pattern pgre
isFullGc = False
mo = pgre.match(line)
# Then match with the full GC pattern
if (mo == None):
mo = fre.match(line)
isFullGc = True
# return tsoffset, heapUsedBeforeGc(Kb), heapUsedAfterGc(Kb), elapsedTime(s), heapSize(Kb), isFullGc
return float(mo.group(1)), int(mo.group(2)), int(mo.group(3)), float(mo.group(5)), int(mo.group(4)), isFullGc
def drawGraph(x1vals, y1vals, x2vals, y2vals, y3vals, x4vals, y4vals, startTime, endTime, output):
"""
Draws a graph of the GC behavior we are interested in. There are three
line graphs and one series of points.
- Memory in use before GC happens (red line)
- Memory in use after GC happens (green line)
- Total JVM heap size (yellow line)
- Times when full GC happens (blue dots on X-axis)
- The Y-axis (for memory usage) numbers are shown in MB
- The X-axis (for time) is plotted in minutes since start
- The title contains the start and end times for this plot
"""
xlabel("Time (minutes)")
ylabel("Heap(Mb)")
title("GC Log (" + startTime + " to " + endTime + ")")
# Heap in use graph over time before garbage collection
plot(x1vals, y1vals, 'r')
# Heap in use graph over time after garbage collection
plot(x2vals, y2vals, 'g')
# Total heap size over time
plot(x2vals, y3vals, 'y')
# Full GC over time
plot(x4vals, y4vals, 'bo')
savefig(output)
def usage():
"""
Prints the script's usage guide.
"""
print "Usage: gcview.py input output [time-start] [time-end]"
print "input = path to gc.log file"
print "output = path to gc.png file"
print "time-start = date in yyyy-MM-dd HH:mm format"
print "time-end = date in yyyy-MM-dd HH:mm format"
sys.exit(-1)
def convertISOToUnixTS(isots):
"""
Takes a timestamp (supplied from the command line) in ISO format, ie
yyyy-MM-dd HH:mm and converts it to seconds since the epoch.
"""
isore = re.compile("(\d{4})-(\d{2})-(\d{2})\s(\d{2}):(\d{2})")
mo = isore.match(isots)
return time.mktime([int(mo.group(1)), int(mo.group(2)), int(mo.group(3)), int(mo.group(4)), int(mo.group(5)), 0, 0, 0, -1])
def baseTimeStamp(logFile):
"""
Since the timestamps in the gc.log file are probably in seconds since
server startup, we want to get an indication of the time the first log
line was written. We do this by getting the ctime of the gc.log file.
"""
return os.lstat(logFile)[ST_CTIME]
def minutesElapsed(currentTS, baseTS):
"""
Convert the timestamp (in seconds since JVM startup) to mins elapsed
since first timestamp entry.
"""
return (currentTS - baseTS) / 60
def timeString(ts):
"""
Return printable version of time represented by seconds since epoch
"""
return time.strftime("%Y-%m-%d %H:%M", time.localtime(ts))
def main():
"""
This is how we are called. Reads the command line args, reads the input
file line by line, calling out to parse() for each line, processing and
pushing the tokens into arrays that are passed into the drawGraph() method.
Example call:
./gcview.py ../tmp/gc.log gc-24h.png
./gcview.py ../tmp/gc.log gc-6h.png "2006-08-13 05:00" "2006-08-13 11:00"
./gcview.py ../tmp/gc.log gc-2h.png "2006-08-13 09:00" "2006-08-13 11:00"
./gcview.py ../tmp/gc.log gc-1h.png "2006-08-13 10:00" "2006-08-13 11:00"
"""
if (len(sys.argv) != 3 and len(sys.argv) != 5):
usage()
input = sys.argv[1]
output = sys.argv[2]
# optional start and end times provided
if (len(sys.argv) == 5):
sliceLogFile = True
startTime = convertISOToUnixTS(sys.argv[3])
endTime = convertISOToUnixTS(sys.argv[4])
else:
sliceLogFile = False
startTime = 0
endTime = 0
# The base time is the ctime for the log file
baseTS = baseTimeStamp(input)
# initialize local variables
timeStampsBeforeGc = []
usedBeforeGc = []
timeStampsAfterGc = []
usedAfterGc = []
heapSizes = []
timeStampsForFullGc = []
fullGcIndicators = []
gcStartTS = -1
gcEndTS = -1
# read input and parse line by line
fin = open(input, 'r')
while (True):
line = fin.readline()
if (line == ""):
break
(tsoffset, usedBefore, usedAfter, elapsed, heapSize, isFullGc) = parse(line.rstrip())
# Set the first timestamp once for the very first record, and keep
# updating the last timestamp until we run out of lines to read
if (gcStartTS == -1):
gcStartTS = tsoffset
gcEndTS = tsoffset
# If start and end times are specified, then we should ignore data
# that are outside the range
if (sliceLogFile):
actualTime = baseTS - gcStartTS + tsoffset
if (actualTime < startTime or actualTime > endTime):
continue
# X and Y arrays for before GC line, X will need postprocessing
timeStampsBeforeGc.append(tsoffset)
usedBeforeGc.append(usedBefore / 1024)
# X and Y arrays for after GC line, X will need postprocessing
timeStampsAfterGc.append(tsoffset + elapsed)
usedAfterGc.append(usedAfter / 1024)
# Y array for heap size (use minOffSetBeforeGC for X), will use
# Y axis for after GC line
heapSizes.append(heapSize / 1024)
# X and Y arrays for Full GC line, X will need postprocessing
if (isFullGc):
timeStampsForFullGc.append(tsoffset)
fullGcIndicators.append(1)
fin.close()
# Convert log start and end time stamps to printable format
if (sliceLogFile):
logStartTS = sys.argv[3]
logEndTS = sys.argv[4]
else:
logStartTS = timeString(baseTS)
logEndTS = timeString(baseTS + gcEndTS - gcStartTS)
# convert timestamps from seconds since JVM startup to minutes elapsed
# since first timestamp entry
startTime = timeStampsBeforeGc[0]
for i in range(len(timeStampsBeforeGc)):
timeStampsBeforeGc[i] = minutesElapsed(timeStampsBeforeGc[i], startTime)
timeStampsAfterGc[i] = minutesElapsed(timeStampsAfterGc[i], startTime)
for i in range(len(timeStampsForFullGc)):
timeStampsForFullGc[i] = minutesElapsed(timeStampsForFullGc[i], startTime)
# Send off to graph results
drawGraph(timeStampsBeforeGc, usedBeforeGc, timeStampsAfterGc, usedAfterGc, heapSizes, timeStampsForFullGc, fullGcIndicators, logStartTS, logEndTS, output)
if __name__ == "__main__":
main()
|
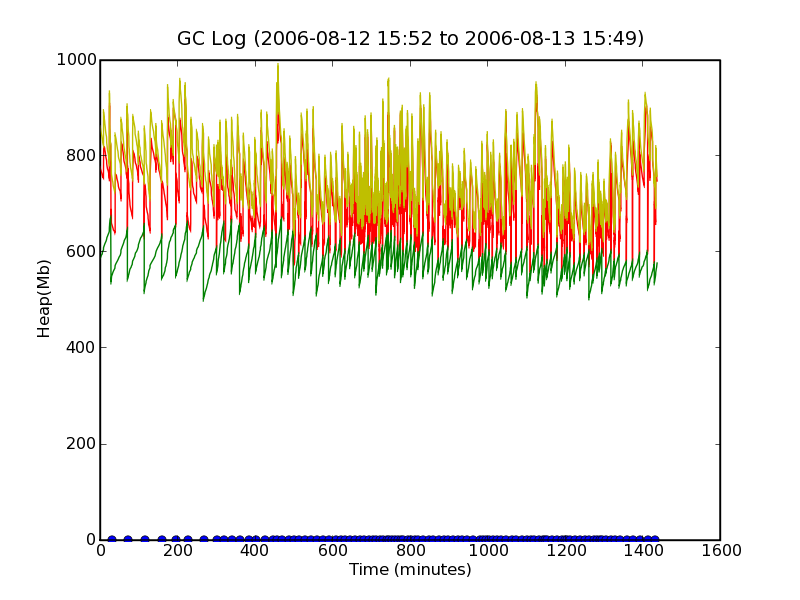
Assuming that gcview.py is in your PATH, then, to chart the entire GC log file (called gc.log) into a PNG chart called gc.png, you would run the following command:
1 | $ gcview.py gc.log gc.png
|
This results in a chart like this one. As you can see, the data in the GC log file spans 24 hours (1440 minutes, from 4pm to 4pm). The yellow line represents the JVM heap size, the red line represents heap usage before GC, and the green line represents heap usage after GC. The heap sizes are in MB. The blue dots on the X-axis represent the points where Full GC occured. The data, unfortunately is quite dense and does not tell us much, except perhaps that JVM heap size reached a max of 1GB somewhere in the 400-600 minute range. It also looks like Full GC happens continuously about 300 minutes into the GC log file, which cant be good, but as we shall see, this is because the scale of the graph is too small.

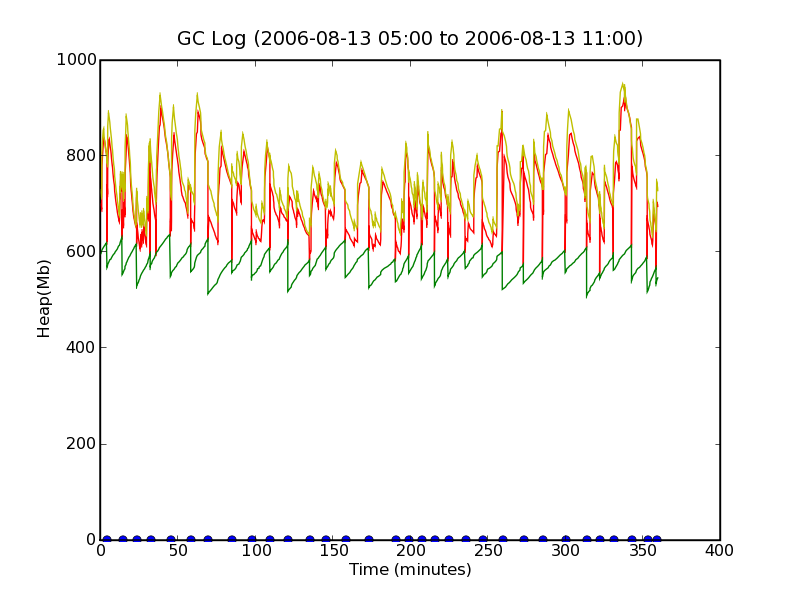
To verify that there really is not continous GC going on, we will take a look at a 6 hour slice in the busy period (5am to 11pm the second day of the log).
1 | $ gcview.py gc.log gc-6h.png "2006-08-13 05:00" "2006-08-13 11:00"
|
produces the following output:

This shows us that there is indeed a more frequent occurence of full GCs at about 8am-9am, and again at 10am-11am, but that normally, full GC happens approximately once every 10 minutes or so. Drilling down further into the 10am-11am band to check if we can see something.
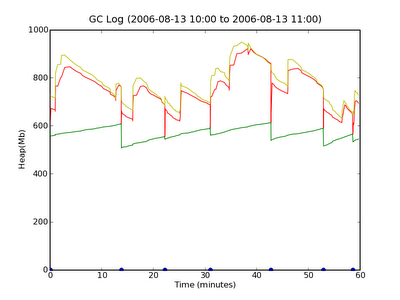
which looks fairly normal. So in our case, we do see more Full GCs happening during times where there are more threads in use in the JVM. What conclusion we would draw from this would depend on other inputs that we have.
I hope you will agree that looking at a chart is more enlightening that looking at a series of log lines. Conversion is quite painless with the script, compared to other approaches I have heard being used, such as parsing the GC log, importing it into Excel, etc. It is also platform independent, since it is all Python, which works on Windows, Linux and Mac OSX. There is some pre-work required with this approach, such as installing matplotlib, but that is a one-time deal. Anyway, I think this script is a useful addition to the Java programmer's collection of tools, and I hope you find it useful too.